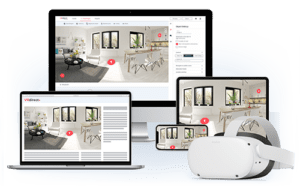
The Analytics feature in the VRdirect Studio is a powerful tool that allows you to gain valuable insights into your VR projects. With this feature, you can monitor the number of visitors, their interactions, and other important metrics. These metrics provide valuable insights for analyzing both overall projects and specific scenes within them.
They include monitoring sessions and unique visitors to gauge user engagement, measuring dwell time to understand how long users interact with content, recording various events like clicks, hovers, scene changes, and time-based actions to assess user behavior. Additionally, exit points help identify where users commonly leave a project, aiding in optimization, while device data reveals the types of devices and access methods used. Lastly, geography data allows for a breakdown of visitors based on their geographic characteristics.
VRdirect does not collect user data. Analytics is only displayed per project in the VRdirect Studio as a product feature for customers.
Analytics is not a platform-side tracking of user data, but a product feature for our customers. No data is collected by VRdirect, but only displayed for our customers in the VRdirect Studio individually per project.
In this blog article, we’ll guide you through the Analytics feature so that you can make the most of your VR experiences and improve your project’s performance.
Enable Analytics
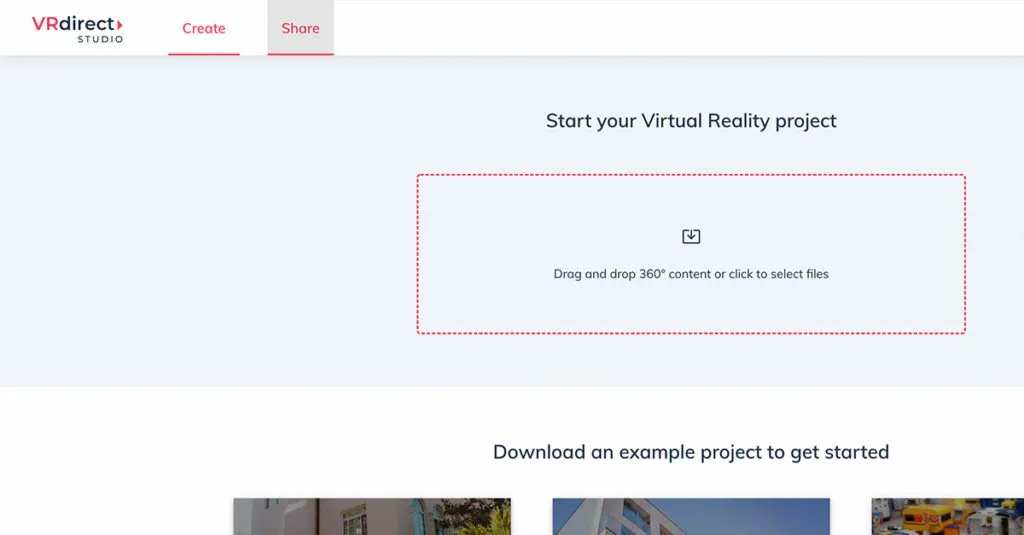
1. Click on the “Share” tab.
2. Select the VR project to analyze.
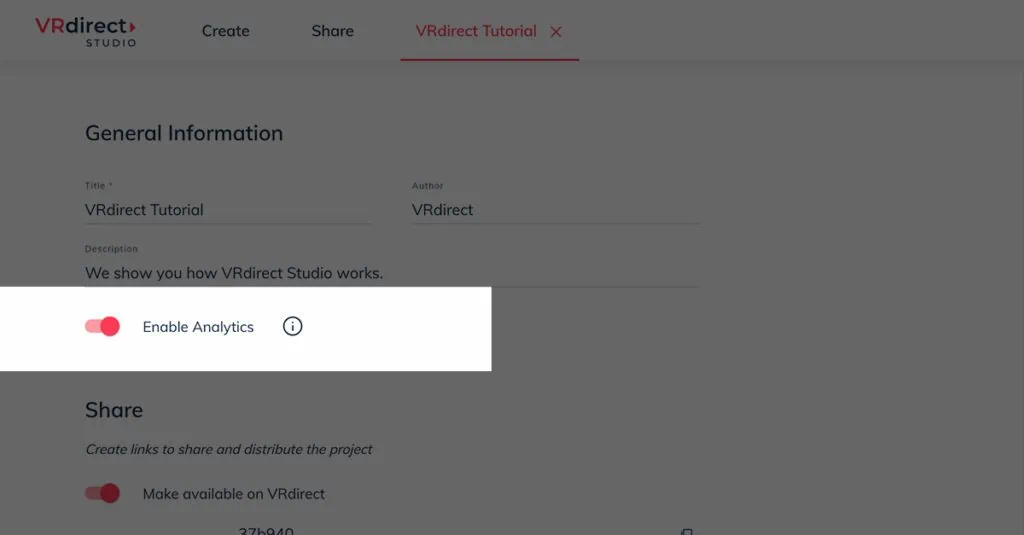
3. Activate the option “Enable Analytics” and publish your change.
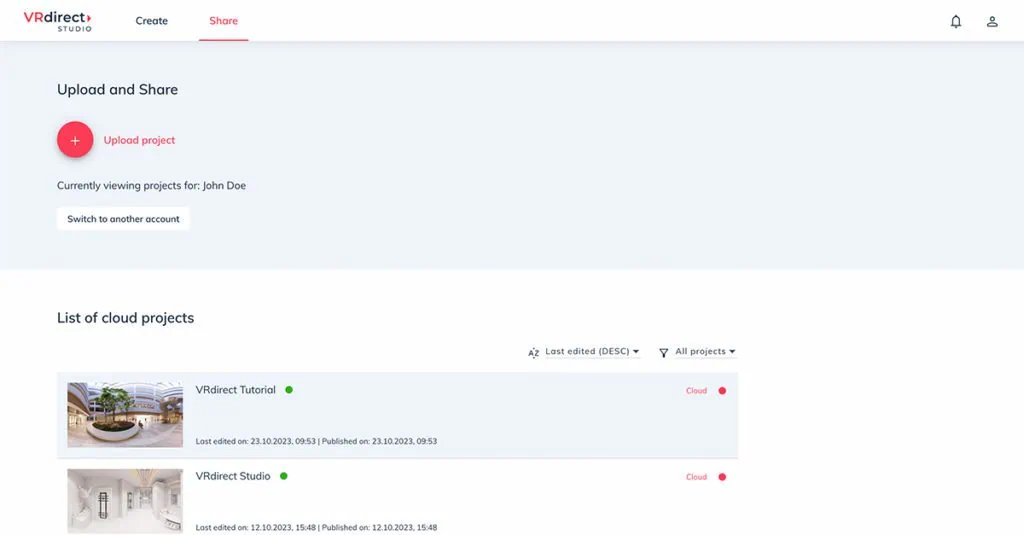
Accessing Analytics
To use the Analytics feature in the VRdirect Studio, you can follow these simple steps:
1. Click on the “Share” option found in the tab bar.
2. Select the VR project to analyze.
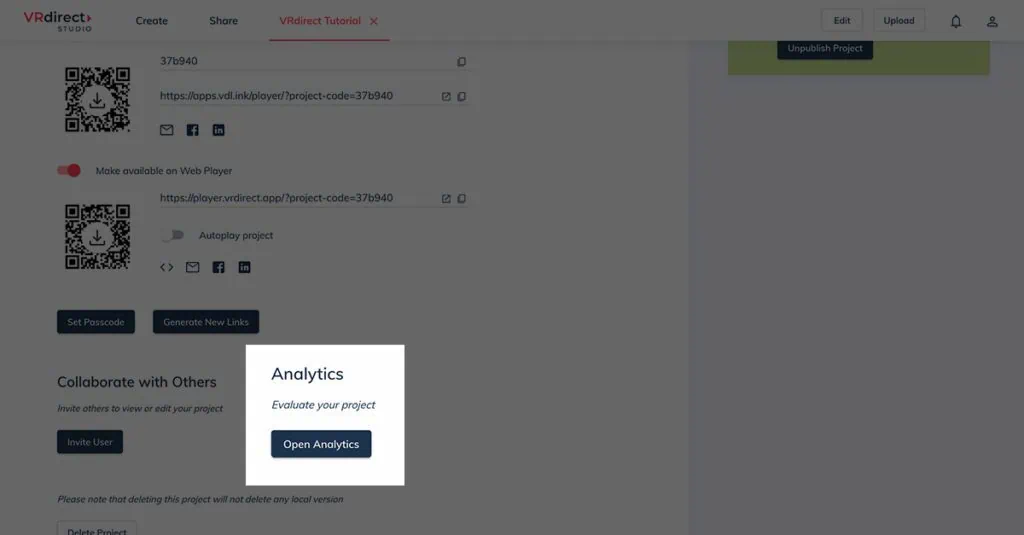
3. Click “Open Analytics” below.
Key Performance Indicators (KPIs):
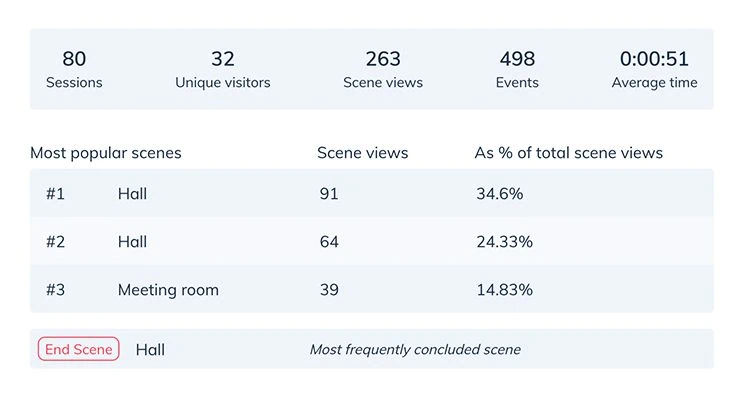
- Number of sessions
- Number of unique visitors
- Number of total scenes visited
- Number of events triggered
- Average time spent in the VR project
Chart Representation:
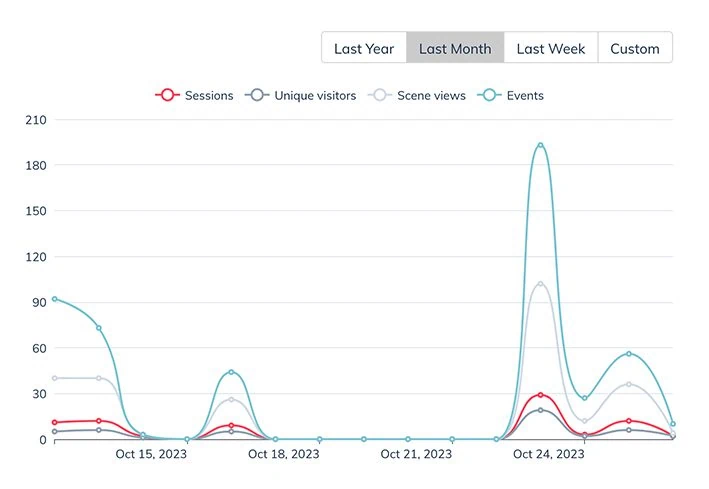
The “Chart Representation” area displays visual representations of data that can be viewed over different periods, including year, month, week, and custom timeframes.
Please note that data is stored for up to one year and is accessible during that time. You can create custom chart views by activating or deactivating specific metrics.
Events:
In the “Events” section, you will get a complete overview of the interactions that take place within your VR project. This includes Interaction Events, Scene Connections, and Time Events. For Time Events, the “Object” column remains empty because these events are automatically triggered.

It is important to give clear and concise names to scenes and objects in your project to make it easy to navigate through them. You can sort the data by various parameters such as the type of event or the time at which the event occurred.
Scenes:

- The number of unique and total visitors per scene.
- The number of events triggered in each scene.
- The average time users spent in a specific scene.
- The "As % of total scene views" value shows the proportion of scene views compared to the project's total scene views in the KPIs section.
Countries:

Device Usage:

You can also determine whether the project was viewed in the WebPlayer (browser) or the native app. If a device is not listed, it means that the project was not accessed on that device. Please keep in mind that project data may not be available in real-time and is usually accessible the day after.
Additionally, it’s crucial to emphasize that for privacy and security purposes, Analytics can only be accessed by the creator of the project, and not by VRdirect or project viewers.
Our Analytics feature is designed to provide customers with valuable insights that can be used to enhance the user-friendliness of their VR projects. By leveraging the power of data, our platform enables you to gain critical metrics, visualize data and make informed decisions that can improve your virtual reality experiences, or evaluate training and quizzes. Ultimately, this helps to increase the overall quality and acceptance of mixed reality within your organization.
Watch our video and learn how to use the Analytics feature: